Toluene (1)
Toluene (methylbenzene or phenylmethane) is a colorless, water-insoluble liquid with an odor similar to that of ordinary paint thinners. Toluene is one of the aromatic compounds that is used as a raw material as well as a chemical solvent. Other applications include paint solvents, paint thinners, silicone sealants, chemical reagents, plastics, printing inks, adhesives, varnishes and disinfectants.
Toluene has the chemical formula C6H5CH3 and does not react with acid or dilute base. Toluene naturally contains less than 0.01% benzene, while the industrial type may contain up to 25% benzene. Toluene reacts with hydroxyl radicals in the air, oxygen atoms (O), ozone (O3) and peroxy radicals (RO2) in which R is an alkyl or aryl group in the form of oxidation products. Table (1) lists the most important characteristics of toluene.
Table (1): The TDS of toluene
| Value | Unit | Characteristic |
| 0.08669 | g/mL | Density (at ℃ 20) |
| 92.13 | g/mol | Molecular Weight |
| -95 | °C | melting point |
| 110.6 | °C | Boiling point |
| 0.47 | g/L | Water solubility (at ℃ 20) |
| 0.590 | cP | Viscosity (at ℃ 20 |
| 4.4 | °C | Ignition temperature |
| 1.497 | — | Refractive Index |
Demand for aromatic compounds in the chemical industry
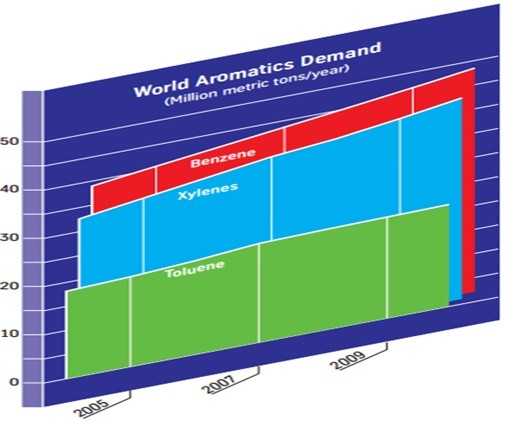
Approximately 110 million tons of aromatic compounds (benzene, toluene, xylene) are produced annually worldwide, with an increase in aromatic compounds demand due to the growth of industries such as styrene, polycarbonates, phenolic resins and nylon. Figure (1) shows the demand for aromatic compounds in the world.

Figure (1): Demand for aromatic compounds in the world
The total annual production capacity of toluene in the United States was about 1,625 tons in 1989. Most of the toluene produced (99.5%) is obtained from petroleum fractions. Approximately 94.5% of the world’s toluene production is generated using the catalytic reforming process. The amount and growth of toluene production capacity in the world, the Middle East and Iran in the range of 2014 to 2019 is shown in Table (2).
Table (2): Toluene production and growth capacity in the period of 2014 to 2019
| Capacity ( million ton) | Capacity growth percentage | Global demand (million ton) | Percentage of demand growth ( million ton) | ||
| world | Middle-east | Iran | |||
| 37.3 | 3.1 | 0.074 | 3.7 | 24.2 | 4.4 |

